
$DELL

DailyPlay – Opening Trade (DELL) – April 18, 2024
DELL Bearish Opening Trade Signal
Investment Rationale
DELL has taken off on the back of AI hype over the past year and trades at its all-time highs both in terms of price and valuation. The question is, are these justified given their future potential? My concern is that the fundamentals just do not seem to add up and the chart is starting to show signs of exhaustion. This warrants a potential pullback as investors rethink equity valuations as 10-year yields shoot towards 5%.
Technical Analysis
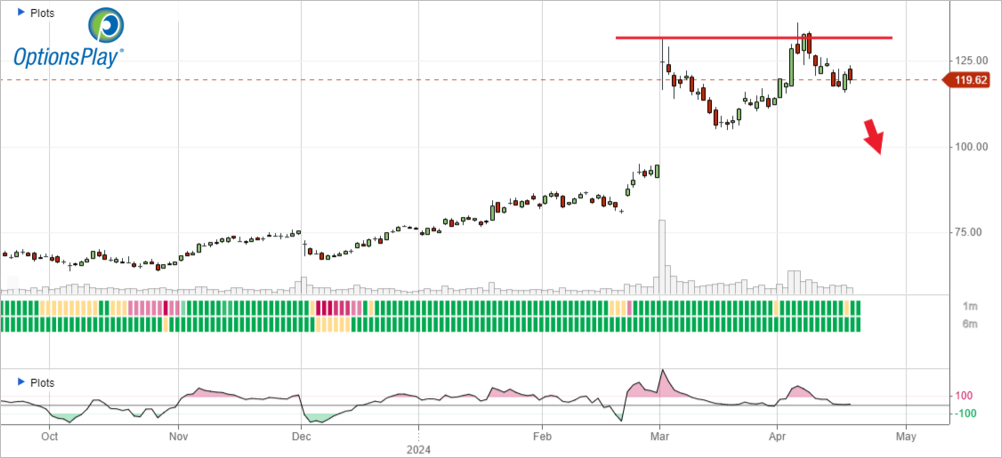
DELL recently gapped higher and formed a double top at $130 with signs of exhaustion from the negative divergence. It currently leaves a gap of $95 that remains unfilled and is our downside target after its $105 support level.
DELL – Daily
Fundamental Analysis
While DELL may seem cheap at only 16x forward earnings with AI as a tailwind, EPS growth is only expected in the single digits and for revenues to be flat. When we couple such underwhelming growth rates with Net margins of only 5%, 16x earnings no longer seems cheap. On the contrary, DELL traded at only 6x forward earnings just 2 years ago, with its historical 10-year average just under 9x. By all other accounts, DELL looks expensive now that it has been inflated by AI hype.
Trade Details
Strategy Details
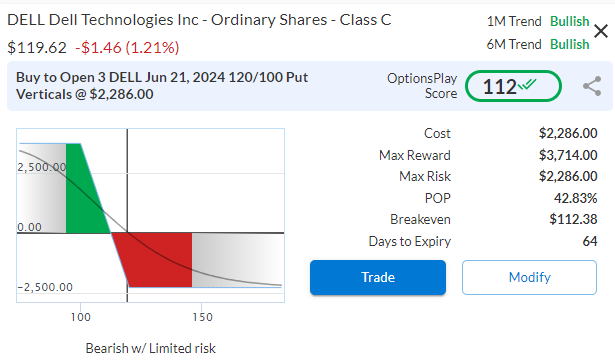
Strategy: Long Put Vertical Spread
Direction: Bearish Debit Spread
Details: Buy to Open 3 Contracts June 21st $120/$100 Put Vertical Spreads @ $7.62 Debit.
Total Risk: This trade has a max risk of $2,286 (3 Contracts x $762) based on a hypothetical $100,000 portfolio risking 2%. We suggest using 2% of your portfolio value and divide it by $762 to select the # contracts for your portfolio.
Counter Trend Signal: This is a bearish trade on a stock that is overbought and expected to pull back.
1M/6M Trends: Bullish/Bullish
Relative Strength: 10/10
OptionsPlay Score: 112
Stop Loss: @ $3.81 Credit. (50% loss of premium paid)
Entering the Trade
Use the following details to enter the trade on your trading platform. Please note that whenever there is a multi-leg option strategy, it should be entered as a single trade.
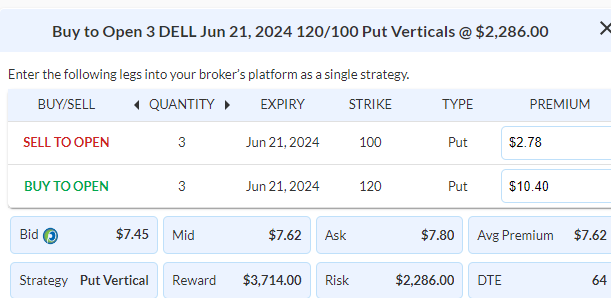
Please note that these prices are based on Wednesday’s closing prices. Should the underlying move significantly during the pre-market hours, we will likely adjust the strikes and prices to reflect a more accurate trade entry.
$NKE

DailyPlay – Opening Trade (NKE) – April 17, 2024
NKE Bullish Opening Trade Signal
Investment Rationale
Nike has underperformed the market and its sector since mid 2021. We have recently seen growth expectations from analysts have bottomed and started to recover. And as China’s growth starts to rebound, valuations near its historical lows, it is time for investors to start paying attention to Nike again as it trades near its multi-year lows.
Technical Analysis
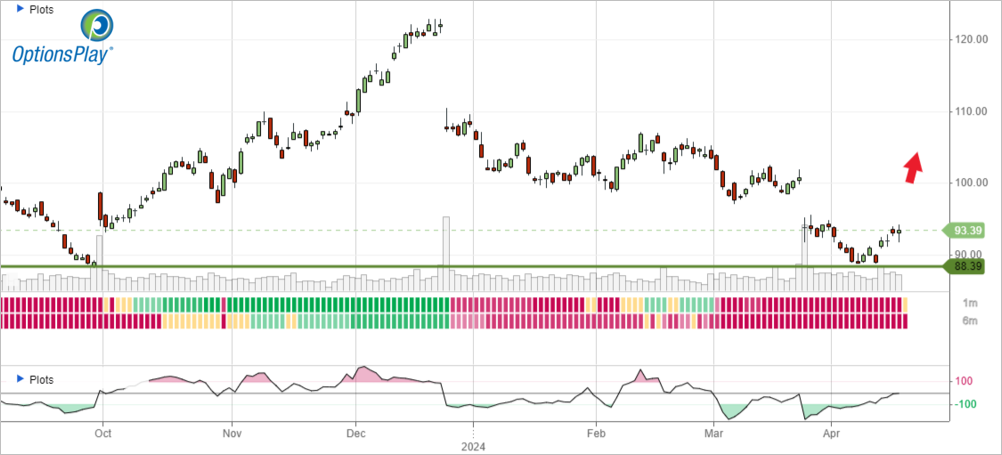
Nike has formed a triple bottom at the $90 support level over the past 3 years and recently it just bounced higher off this support. With a gap above at $100, our short-term upside target would be to fill that gap and $105 resistance level above that.
NKE – Daily
Fundamental Analysis
NKE currently trades at the lower end of its historical valuation at 24x forward earnings, which is a 20% discount to its historical average and well below the 30-40x it traded for the previous few years. With growth expectations starting to recover on the back of China growth and Olympics this year, NKE is looking at a second half recovery of sales declines.
Trade Details
Strategy Details
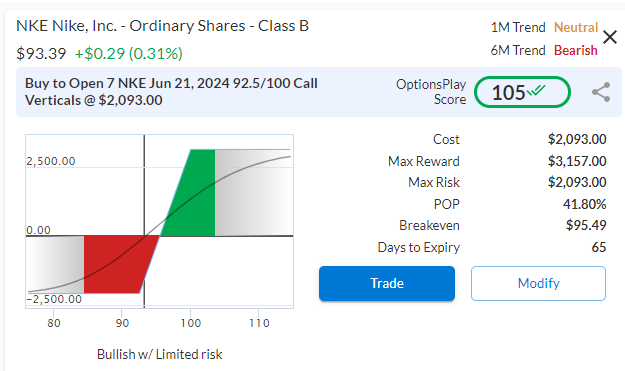
Strategy: Long Call Vertical Spread
Direction: Bullish Debit Spread
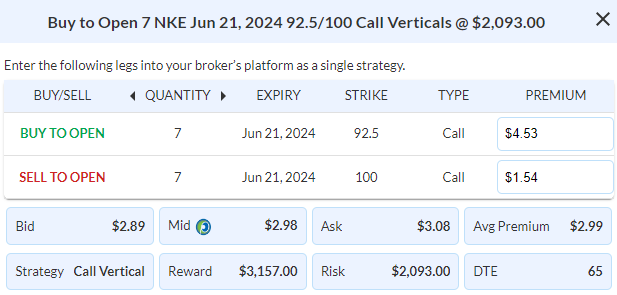
Details: Buy to Open 7 Contracts June 21st $92.50/$100 Call Vertical Spreads @ $2.99 Debit.
Total Risk: This trade has a max risk of $2,093 (7 Contracts x $299) based on a hypothetical $100,000 portfolio risking 2%. We suggest using 2% of your portfolio value and divide it by $299 to select the # contracts for your portfolio.
Counter Trend Signal: This is a bullish trade on a stock that is in a bearish trend and bouncing higher off support.
1M/6M Trends: Neutral/ Bearish
Relative Strength: 3/10
OptionsPlay Score: 105
Stop Loss: @ $1.50 Credit. (50% loss of premium paid)
Entering the Trade
Use the following details to enter the trade on your trading platform. Please note that whenever there is a multi-leg option strategy, it should be entered as a single trade.
Please note that these prices are based on Wednesday’s closing prices. Should the underlying move significantly during the pre-market hours, we will likely adjust the strikes and prices to reflect a more accurate trade entry.

DailyPlay – Portfolio Review & Closing Trades (CSX, FTNT) – April 16, 2024
Closing Trades
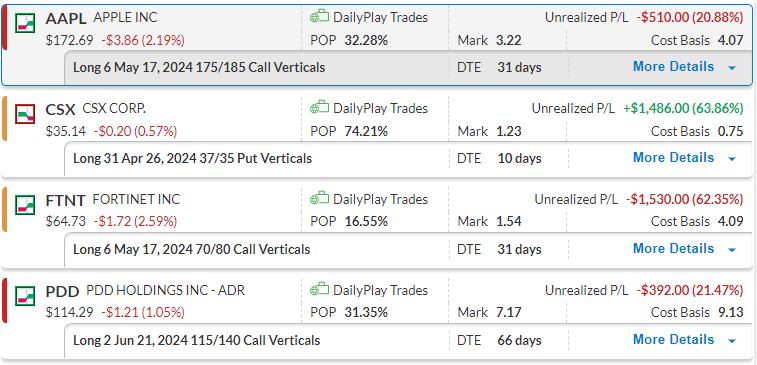
- CSX- 63.86% Gain: Sell to Close 31 Contracts (or 100% of your Contracts) April 26th $37/$35 Put Vertical Spreads @ $1.23 Credit. DailyPlay Portfolio: By Closing all 31 Contracts, we will receive $3,813. We opened these 31 Contracts on March 26 @ $0.75 Debit. The average gain, therefore, is $48 per contract, with a total gain of around 1.5% of our Portfolio.
- FTNT – 62.35% loss: Sell to Close 6 Contracts (or 100% of your Contracts) May 17th $70/$80 Call Vertical Spreads @ $1.54 Credit. DailyPlay Portfolio: By Closing all 6 Contracts, we will receive $924. We opened these 6 Contracts on April 4 @ $4.09 Debit. The average loss, therefore, is $255 per contract, with a total loss of around 1.5% of our Portfolio.
DailyPlay Portfolio Review
Investment Rationale
As a reminder, the goal of our DailyPlay signals is to teach the best practices for maximizing every idea for profitability. We strive to exemplify how professional traders reach profitability through these ideas. Because even the best ideas will underperform if losses are not cut quickly and profits are taken too soon. As I review the DailyPlay portfolio there are multiple positions that require managing today. As CSX approaches our $35 lower strike price, it is time to start taking profits with only 10 days left to expiration. We are also going to close FTNT, which has triggered a stop loss level.
Our Trades
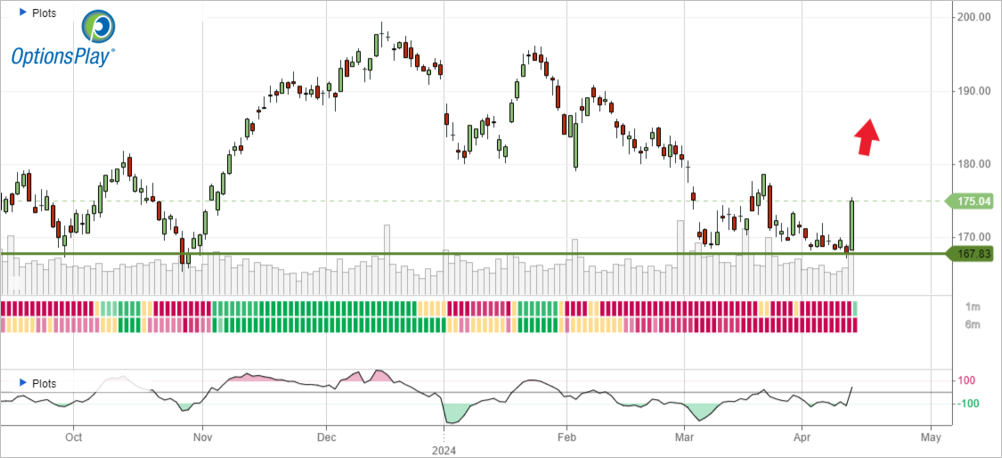
AAPL – 31 DTE
Bullish Debit Spread – Uptrend remains intact with support at $169. If we break below $169, we will look to cut losses, otherwise we are targeting $185 initially to the upside.
CSX – 10 DTE
Bearish Debit Spread – We are closing this trade today to gain 1.5% on our Portfolio.
FTNT – 31 DTE
Bullish Debit Spread – FTNT broke below a level of support which invalidates our bullish thesis on this trade. As such we are closing this position today.
PDD – 66 DTE
Bullish Debit Spread – Still holding onto support at around $114. We will continue to monitor this trade over the next few days.
$AAPL
DailyPlay – Opening Trade (AAPL) – April 12, 2024
AAPL Bullish Opening Trade Signal
Investment Rationale
After lagging behind the market since July of last year, AAPL’s underperformance is starting to emerge as an opportunity. With its recent announcements of integrating AI into its iPhone and Mac lines, there is a thesis for AAPL to start playing catchup with the rest of the tech sector.
Technical Analysis
AAPL has been rangebound between $165 and $200 for the past year and just bounced off the major support level yesterday. This creates a favorable risk/reward ratio for long exposure with stops below $165 and an upside target of $200.
AAPL – Daily
Fundamental Analysis
AAPL now trades at only 25x forward earnings as its price declines while analysts revised its EPS growth up to 13% YoY on the back of strong sales and gains in its subscriptions business. These valuations are starting to become more attractive, especially with their AI-focused chips in the upcoming generation of ARM-based silicon.
Trade Details
Strategy Details
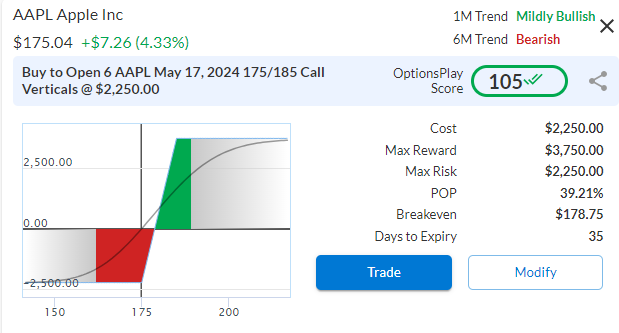
Strategy: Long Call Vertical Spread
Direction: Bullish Debit Spread
Details: Buy to Open 6 Contracts May 17th $175/$185 Call Vertical Spreads @ $3.75 Debit.
Total Risk: This trade has a max risk of $2,250 (6 Contracts x $375) based on a hypothetical $100,000 portfolio risking 2%. We suggest using 2% of your portfolio value and divide it by $375 to select the # contracts for your portfolio.
Trend Continuation Signal: This is a bullish trade on a stock that is bouncing higher off support.
1M/6M Trends: Mildly Bullish/ Bearish
Relative Strength: 3/10
OptionsPlay Score: 105
Stop Loss: @ $1.88 Credit. (50% loss of premium paid)
Entering the Trade
Use the following details to enter the trade on your trading platform. Please note that whenever there is a multi-leg option strategy, it should be entered as a single trade.
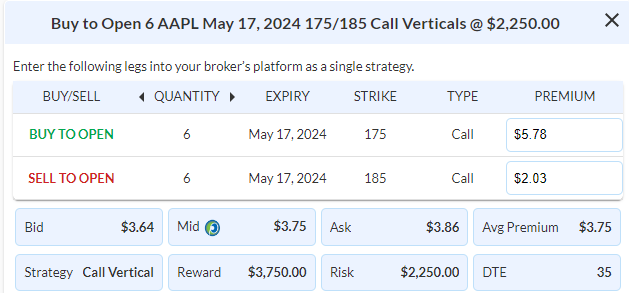
Please note that these prices are based on Thursday’s closing prices. Should the underlying move significantly during the pre-market hours, we will likely adjust the strikes and prices to reflect a more accurate trade entry.
$BLK
DailyPlay – Opening Trade (BLK) Closing Trades (BMY, INTC) – April 11, 2024
Closing Trades
- BMY – 57.84% loss: Sell to Close 12 Contracts (or 100% of your Contracts) May 17th $52.50/$57.50 Call Vertical Spreads @ $0.78 Credit. DailyPlay Portfolio: By Closing all 12 Contracts, we will receive $936. We opened these 12 Contracts on March 28 @ $1.85 Debit. The average loss, therefore, is $107 per contract, with a total loss of around 1% of our Portfolio.
- INTC – 67.65% Gain: Sell to Close 20 Contracts (or 100% of your Contracts) May 17th $42/$37 Put Vertical Spreads @ $3.41 Credit. DailyPlay Portfolio: By Closing all 20 Contracts, we will receive $6,820. We opened 12 of the 20 Contracts on March 28 @ $1.57 Debit, and then another 8 Contracts on April 5 @ $2.72 Debit. The average gain, therefore, is $138 per contract, with a total gain of around 2.8% of our Portfolio.
BLK Bearish Opening Trade Signal
Investment Rationale
As we start another earnings season, financials will kick things off at the end of this week. Blackrock reports Friday morning and has recently started to show some cracks in their business and I have concerns of a weakening outlook for the world’s largest asset manager.
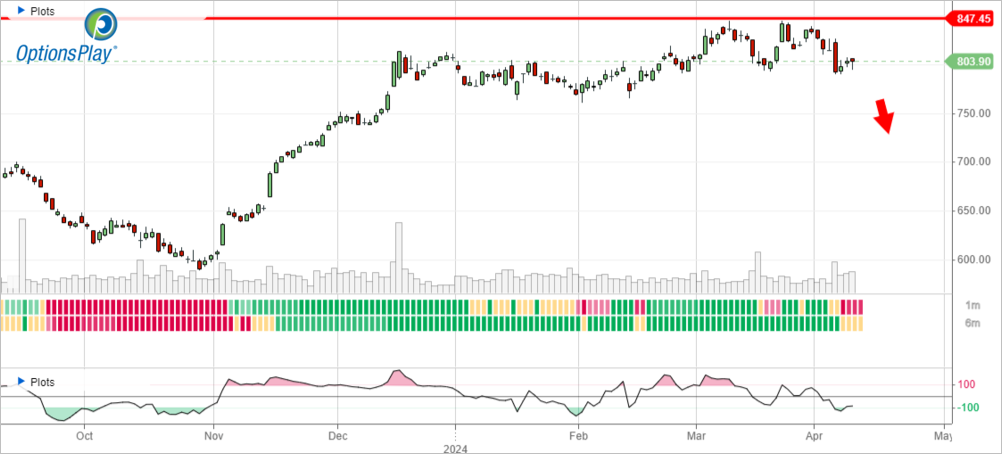
Technical Analysis
If we start with a longer term chart, we see that after spending 2 years trading below its key $750 resistance level, it finally broke out at the end of last year. But so far, the breakout has not carried higher and momentum is starting to show exhaustion with the negative divergence. This leads me to believe that in the short run, it’s more likely to revisit $750 than continue higher. And if we Zoom in, we see that the $790 short term support was just broken along with underperformance relative to the S&P 500 and momentum has turned negative (MACD). This weakness going into earnings is more likely a signal for further downside.
BLK – Daily
Fundamental Analysis
And if we dive into the business, growth rates for both top and bottom line are nominal. Revenue and EPS has both grown by only 5-6% per year over the past 5 years and analysts aren’t expecting a significant uptick going forward. This is reflected in the valuation of 22x earnings, which isn’t significantly over or undervalued now. So, I anticipate this to trade more on the outlook for asset prices going forward since BLK’s model is based on assessing fees for AUM. If assets were to decrease, so does revenue. With yields rising and rate cut expectations declining, I expect their asset growth projections to also slow.
Trade Details
Strategy Details
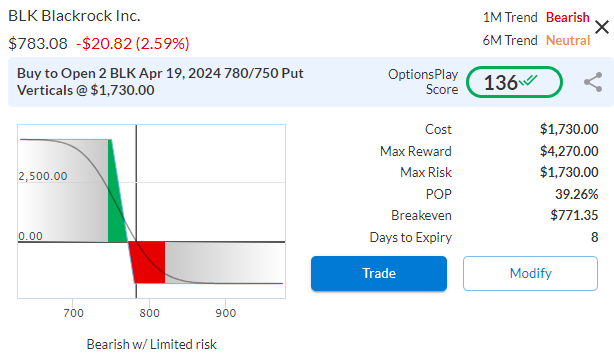
Strategy: Long Put Vertical Spread
Direction: Bearish Debit Spread
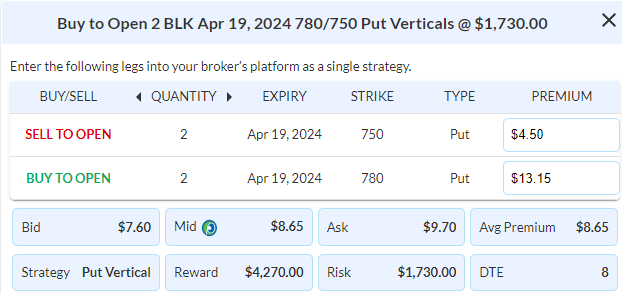
Details: Buy to Open 2 Contracts April 19th $780/$750 Put Vertical Spreads @ $8.65 Debit.
Total Risk: This trade has a max risk of $1,730 (2 Contracts x $865) based on a hypothetical $100,000 portfolio risking 2%. We suggest using 2% of your portfolio value and divide it by $865 to select the # contracts for your portfolio.
Trend Continuation Signal: This is a bearish trade on a stock that failed to break higher, and is expected to pull back.
1M/6M Trends: Bearish/Neutral
Relative Strength: 8/10
OptionsPlay Score: 136
Stop Loss: @ $4.33 Credit. (50% loss of premium paid)
Entering the Trade
Use the following details to enter the trade on your trading platform. Please note that whenever there is a multi-leg option strategy, it should be entered as a single trade.
Please note that these prices are based on Wednesday’s closing prices. Should the underlying move significantly during the pre-market hours, we will likely adjust the strikes and prices to reflect a more accurate trade entry.
DailyPlay – Portfolio Review – April 10, 2024
DailyPlay Portfolio Review
Investment Rationale
All eyes are on the CPI print today, with bond traders starting to pare back some of the hawkish bets that we’ve seen over the past few weeks. Until we have more clarity from the CPI print, we are going to do without adding additional exposure to our portfolio.
Our Trades
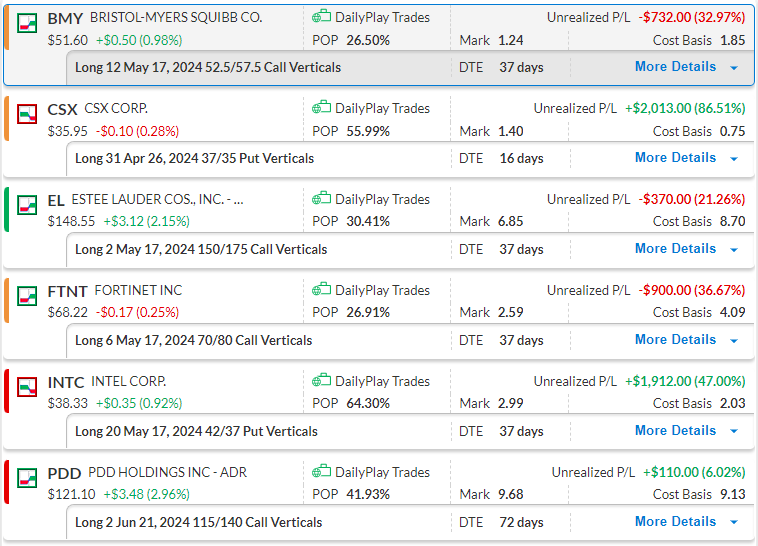
BMY – 37 DTE
Bullish Debit Spread – We’re just trading around our $51.50 stop loss level, however, it has held this support level and with 38 days left, we intend on holding on to this position for now.
CSX – 16 DTE
Bearish Debit Spread – Trade has continued to work in our favor towards our $33.50 target price, but is starting to show signs of exhaustion on this selloff and we are on watch for potential Take Profit opportunities.
EL – 37 DTE
Bullish Debit Spread – After a poor start, EL is starting to outperform the markets again, and with 38 days left, we will continue to hold onto this position.
FTNT – 37 DTE
Bullish Debit Spread – Still holding its $67 support level and with 38 days left to expiration, we will continue to hold and monitor this position.
INTC – 37 DTE
Bearish Debit Spread – This trade is working well and we have already added exposure to this position, our downside target is $34.50, and look to take profits around that area.
PDD – 72 DTE
Bullish Debit Spread – We just entered this trade yesterday and working well as Chinese internet stocks are showing strength and momentum.
$PDD
DailyPlay – Opening Trade (PDD) – April 9, 2024
PDD Bullish Opening Trade Signal
Investment Rationale
A few weeks ago, FDX reported better-than-expected earnings, showing both the resilience and uptick in shipping volumes for 2024. As PDD’s Temu competes with Amazon and Walmart on price, FDX’s earnings confirm that the strategy is working. Despite slower shipping times, Temu offers pricing that is substantially lower and looks to continue growing its market share globally. With its recent underperformance, PDD’s price represents an opportunity to add long exposure with a favorable risk/reward ratio.
Technical Analysis
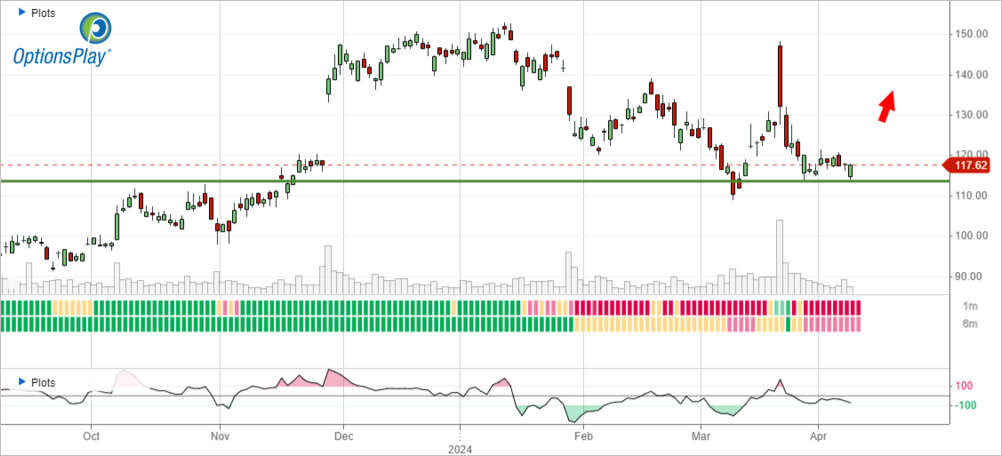
After breaking out above $113 resistance level in Nov of last year, PDD gapped higher but has recently pulled back to this important support level. This provides a favorable entry point from a risk/reward ratio. A break below $109 would suggest that our thesis is incorrect, but the upside is well into the $140’s as our initial upside target.
PDD – Daily
Fundamental Analysis
With lofty analyst expectations of over 50% annual Revenue Growth and 25%+ EPS growth, PDD is downright cheap at only 13x forward earnings. Despite the growth rate, PDD remains very profitable with strong operating margins and FCF generation. This significantly reduces the downside risk of long exposure and aligns the technicals with strong fundamentals.
Trade Details
Strategy Details
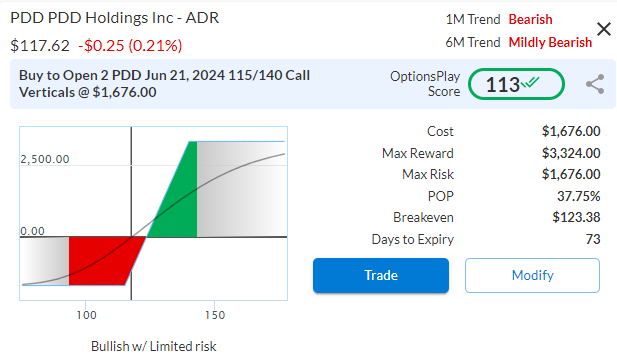
Strategy: Long Call Vertical Spread
Direction: Bullish Debit Spread
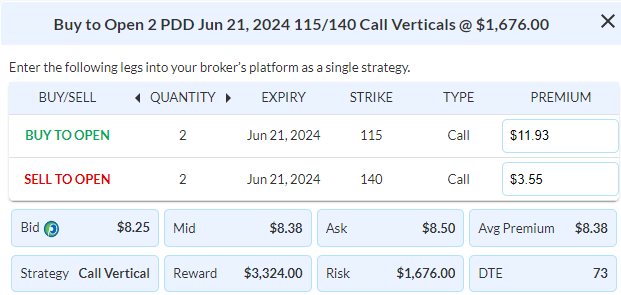
Details: Buy to Open 2 Contracts June 21st $115/$140 Call Vertical Spreads @ $8.38 Debit.
Total Risk: This trade has a max risk of $1,676 (2 Contracts x $838) based on a hypothetical $100,000 portfolio risking 2%. We suggest using 2% of your portfolio value and divide it by $838 to select the # contracts for your portfolio.
Counter Trend Signal: This is a bullish trade on a bearish stock that found support and is expected to bounce higher.
1M/6M Trends: Bearish/Mildly Bearish
Relative Strength: 5/10
OptionsPlay Score: 113
Stop Loss: @ $4.19 Credit. (50% loss of premium paid)
Entering the Trade
Use the following details to enter the trade on your trading platform. Please note that whenever there is a multi-leg option strategy, it should be entered as a single trade.
Please note that these prices are based on Monday’s closing prices. Should the underlying move significantly during the pre-market hours, we will likely adjust the strikes and prices to reflect a more accurate trade entry.
$DEO

DailyPlay – Portfolio Review & Closing Trade (DEO) – April 8, 2024
Closing Trade
- DEO – 60.63% loss: Sell to Close 4 Contracts (or 100% of your Contracts) April 19th $145/$155 Call Vertical Spreads @ $2.00 Credit. DailyPlay Portfolio: By Closing all 4 Contracts, we will receive $800. We opened these 4 Contracts on March 8 @ $5.08 Debit. The average loss, therefore, is $308 per contract, with a total loss of just over 1% of our Portfolio.
DailyPlay Portfolio Review
Our Trades
BMY – 39 DTE
Bullish Debit Spread – Our key level is $53, if this level fails over the next few trading days, we will likely look to cut our position.
CSX – 18 DTE
Bearish Debit Spread – This trade is moving in our direction and we will closely monitor it over the next few days, to potentially add more exposure.
DEO – 11 DTE
Bullish Debit Spread – We are closing this position today as it has hit our stop loss level of 50% loss.
EL – 39 DTE
Bullish Debit Spread – A break and close above $150 would confirm our bullish thesis on this trade, so the next few days will be decisive.
FTNT – 39 DTE
Bullish Debit Spread – A break and close above $72 would confirm our bullish thesis for this trade. We will keep a close eye on this position.
INTC – 39 DTE
Bearish Debit Spread – We recently added more exposure to this trade and we are up over 40%. As it is a Debit Spread, we will aim to close this position at around 100% gain.
$INTC
DailyPlay – Opening Trade (INTC) – April 5, 2024
INTC Bearish Opening Trade Signal
Investment Rationale
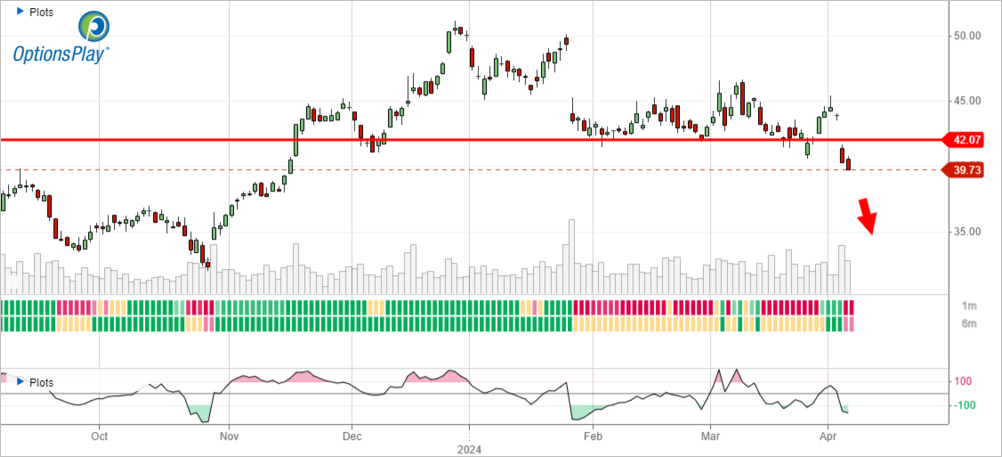
INTC broke below support at $42 after it gapped lower on Tuesday. This has come after news from INTC about job cuts and a reorganization within the company.
As Price Action has confirmed our bearish thesis on this trade, we are therefore adding to our existing INTC position to extend our gains. We expect to see a continuation of this trend. The next area of support is at $37 where we will re-evaluate these positions.
INTC – Daily
Trade Details
Strategy Details
Strategy: Long Put Vertical Spread
Direction: Bearish Debit Spread
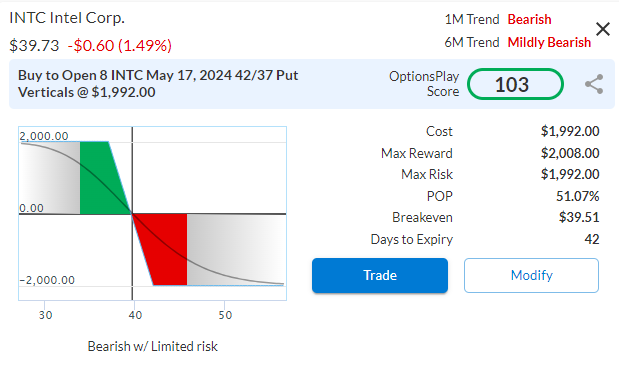
Details: Buy to Open 8 Contracts May 17th $42/$37 Put Vertical Spreads @ $2.49 Debit.
Total Risk: This trade has a max risk of $1,992 (8 Contracts x $249) based on a hypothetical $100,000 portfolio risking 2%. We suggest using 2% of your portfolio value and divide it by $249 to select the # contracts for your portfolio.
Trend Continuation Signal: This is a bearish trade on a stock that broke below support in a confirmed bearish trend.
1M/6M Trends: Bearish/Mildly Bearish
Relative Strength: 3/10
OptionsPlay Score: 103
Stop Loss: @ $1.25 Credit. (50% loss of premium paid)
Entering the Trade
Use the following details to enter the trade on your trading platform. Please note that whenever there is a multi-leg option strategy, it should be entered as a single trade.

Please note that these prices are based on Thursday’s closing prices. Should the underlying move significantly during the pre-market hours, we will likely adjust the strikes and prices to reflect a more accurate trade entry.
$FTNT
DailyPlay – Opening Trade (FTNT) – April 4, 2024
FTNT Bullish Opening Trade Signal
Investment Rationale
With major cybersecurity hacks seemingly occurring every week, cybersecurity as a sector remains an incredibly strong industry for investors. And as a leader in cybersecurity subscriptions and support, FTNT not only has a competitive edge but also exhibits strong fundamentals that align with its recent relative strength.
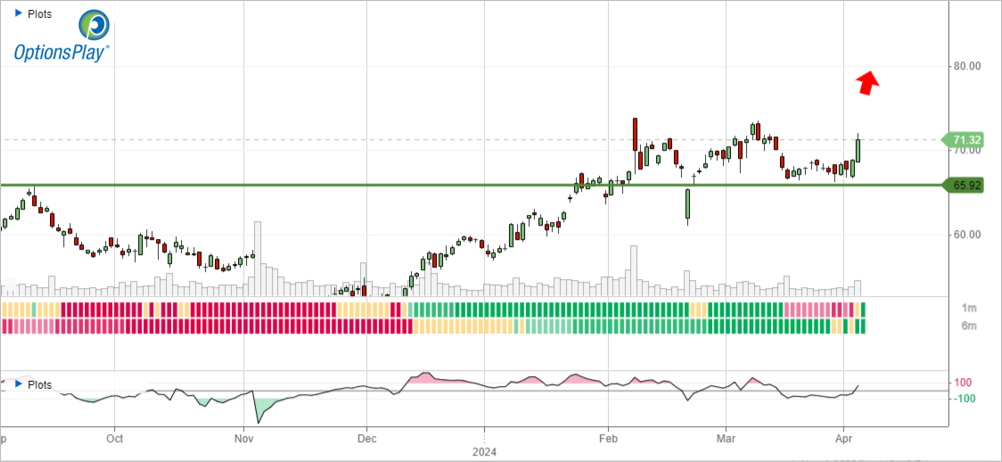
Technical Analysis
After gapping lower nearly 3 quarters ago below its key $74 support level, FTNT has rallied back up to this important resistance and is potentially ready to break out higher. Recent volume near its $67 support level has been encouraging and providing me with more confidence that FTNT has the relative strength and momentum to break out above $74 back towards its $80 52-week highs.
FTNT – Daily
Fundamental Analysis
FTNT currently trades at 40x forward earnings, which may seem high, but is on the lower end of its historical valuation. And we have to factor in the 22% EPS growth that analysts expect for this year and its incredibly strong financial position. With operating margins exceeding 23% and its low debt, FTNT is built for growth but has the balance sheet to whether any uncertainty.
Trade Details
Strategy Details
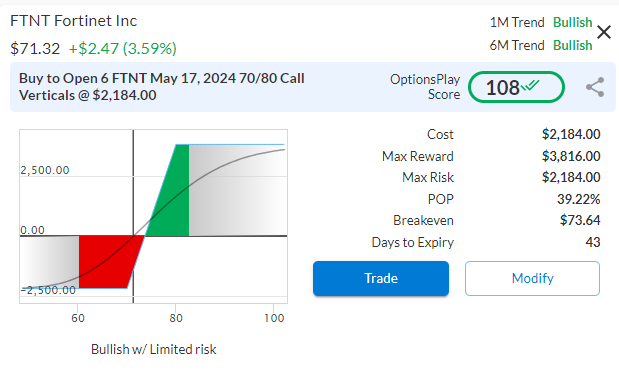
Strategy: Long Call Vertical Spread
Direction: Bullish Debit Spread
Details: Buy to Open 6 Contracts May 17th $70/$80 Call Vertical Spreads @ $3.64 Debit.
Total Risk: This trade has a max risk of $2,184 (6 Contracts x $364) based on a hypothetical $100,000 portfolio risking 2%. We suggest using 2% of your portfolio value and divide it by $364 to select the # contracts for your portfolio.
Trend Continuation Signal: This is a bullish trade on a stock that recently broke higher off a level of support.
1M/6M Trends: Bullish/Bullish
Relative Strength: 8/10
OptionsPlay Score: 108
Stop Loss: @ $1.82 Credit. (50% loss of premium paid)
Entering the Trade
Use the following details to enter the trade on your trading platform. Please note that whenever there is a multi-leg option strategy, it should be entered as a single trade.
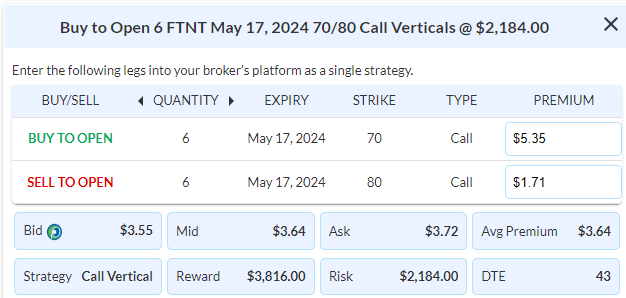
Please note that these prices are based on Wednesday’s closing prices. Should the underlying move significantly during the pre-market hours, we will likely adjust the strikes and prices to reflect a more accurate trade entry.