
$EL

DailyPlay – Opening Trade (EL) – April 2, 2024
EL Bullish Opening Trade Signal
Investment Rationale
We’ve seen a noticeable uptick in volume and interest in EL, after struggling significantly for the last two years to formulate a turnaround. Has EL finally bottomed and proven that its business is investable again? In my opinion with its strong expected future growth and high margins, EL is quite undervalued and offers an attractive risk/reward for bullish exposure.
Technical Analysis
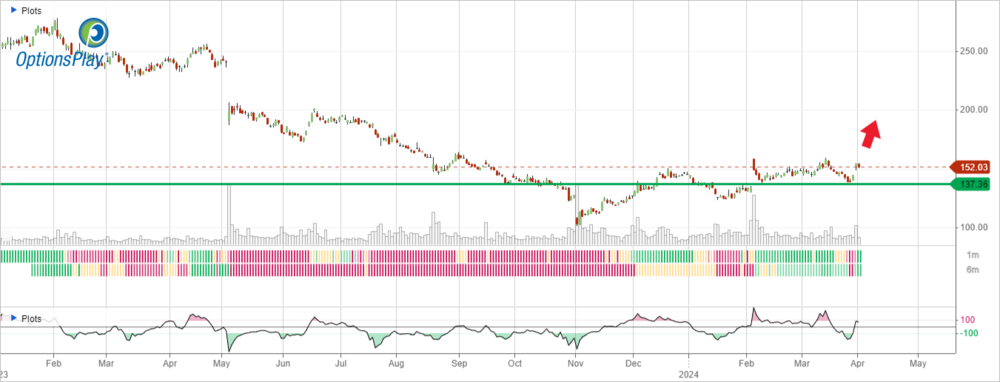
After peaking at the end of 2021 around $375, EL has had a hard fall from grace, down over 70%, to just shy of $100 at the end of last year. Since then, the stock has continued to complete a bottoming formation and has now printed 3 successful higher lows. This suggests that the downtrend has completed and is now a potential candidate to reverse back into a bullish trend. The stock has made multiple attempts to break out above $160. If the stock can break above $160, it would start to target the low $200’s and a $235 gap fill with a stop just below $140.
EL – Daily
Fundamental Analysis
While EL’s forward earnings ratio may seem high initially at 36x, we have to consider the over 20% EPS growth rate that is expected for this year and nearly 88% expected for next year. Couple that with gross margins that stand at 70%, EL stands heads and shoulders above its peers and trades at a relative discount to its own history. If we use average historical valuations of 46x forward earnings, EL’s fair value sits around the $235 gap-fill area.
Trade Details
Strategy Details
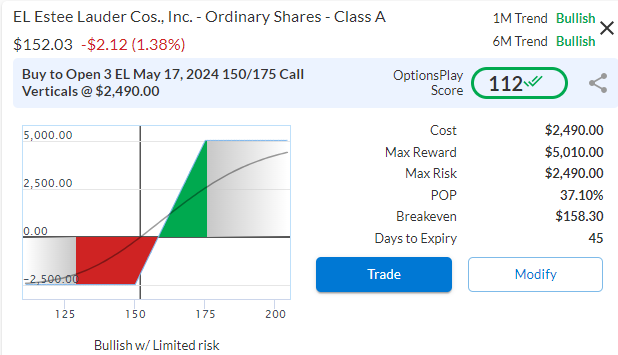
Strategy: Long Call Vertical Spread
Direction: Bullish Debit Spread
Details: Buy to Open 2 Contracts May 17th $150/$175 Call Vertical Spreads @ $8.30 Debit.
Total Risk: This trade has a max risk of $1,660 (2 Contracts x $830) based on a hypothetical $100,000 portfolio risking 2%. We suggest using 2% of your portfolio value and divide it by $830 to select the # contracts for your portfolio.
Trend Continuation Signal: This is a bullish trade on a stock that recently broke higher off a level of support.
1M/6M Trends: Bullish/Bullish
Relative Strength: 5/10
OptionsPlay Score: 112
Stop Loss: @ $4.15 Credit. (50% loss of premium paid)
Entering the Trade
Use the following details to enter the trade on your trading platform. Please note that whenever there is a multi-leg option strategy, it should be entered as a single trade.
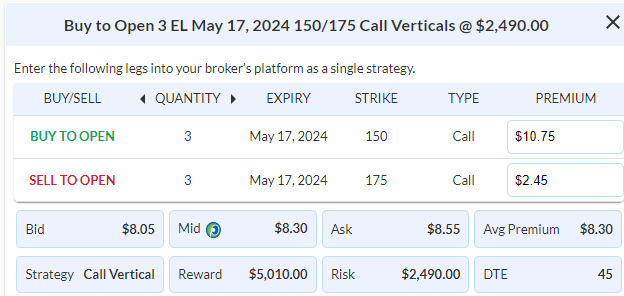
Please note that these prices are based on Wednesday’s closing prices. Should the underlying move significantly during the pre-market hours, we will likely adjust the strikes and prices to reflect a more accurate trade entry.
$TLT

DailyPlay – Closing Trade (TLT) – April 1, 2024
Closing Trade
- TLT – 45.18% loss: Sell to Close 10 Contracts (or 100% of your Contracts) May 17th $93 Puts @ $1.08 Credit. DailyPlay Portfolio: By Closing all 10 Contracts, we will receive $1,080. We opened these 10 Contracts on March 20 @ $1.87 Debit. The average loss, therefore, is $79 per contract, with a total loss of less than 1% of our Portfolio.
Investment Rationale
We placed this trade as a hedge against a more hawkish tone during the FOMC meeting and at this point, we no longer need this hedge.
$BMY
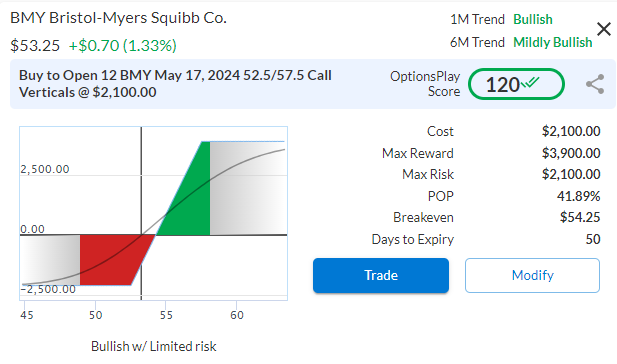
DailyPlay – Opening Trade (BMY) – March 28, 2024
BMY Bullish Opening Trade Signal
Investment Rationale
We are reentering a position in BMY after being stopped out a couple of weeks ago from our initial bullish position. Our technical and fundamental thesis has not changed, we simply were a little too early. This also is a teaching moment for traders who have ever been stopped out of a trade, and become gun shy about getting back in after feeling burned, only to see the stock eventually turn in their expected direction. Stop losses are a form of discipline that we cannot violate, and sometimes we may need a second and potentially even a third try to eventually catch a stock near it’s bottom or top.
Technical Analysis
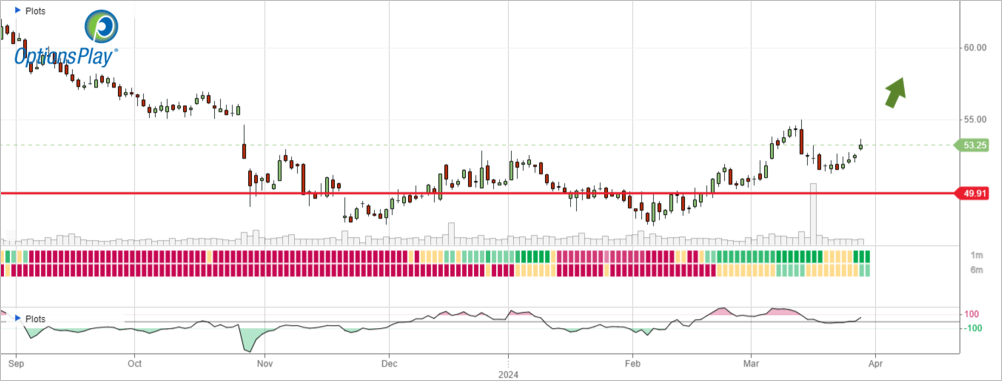
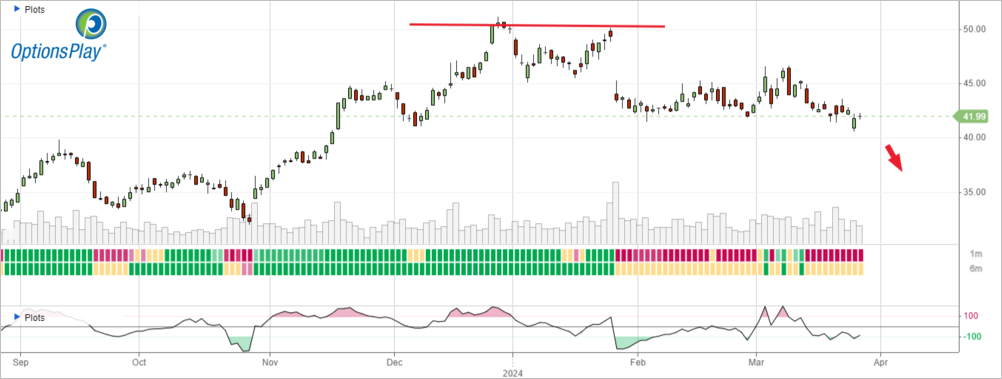
After bottoming over the past 6 months, BMY broke out above its $53 resistance level, only to see it fail a few days later. Since then, it has held its $51.50 support level and formed a higher low and breaking out above $53 again. We’re going to re-establish a long position on this new breakout with an initial upside target of $59.
BMY – Daily
Fundamental Analysis
BMY trades at only 7.5x forward earnings despite flat EPS, Revenue and FCF. This is a significant discount to the market that warrants further research given the outlook for its drug pipeline. BMY have acquired multiple pharmaceutical companies with some starting to pay off with an FDA approval for their lung cancer drug Augtyro. Additionally, multiple drugs in their pipeline that have been approved this past year are starting to see strong QoQ sales growth. So, with analysts sour on BMY, I believe now is the best time to have any eye on this 136 year old pharmaceutical company.
Trade Details
Strategy Details
Strategy: Long Call Vertical Spread
Direction: Bullish Debit Spread
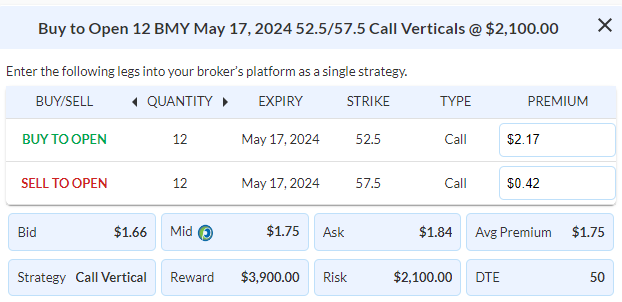
Details: Buy to Open 12 Contracts May 17th $52.50/$57.50 Call Vertical Spreads @ $1.75 Debit.
Total Risk: This trade has a max risk of $2,100 (12 Contracts x $175) based on a hypothetical $100,000 portfolio risking 2%. We suggest using 2% of your portfolio value and divide it by $175 to select the # contracts for your portfolio.
Trend Continuation Signal: This is a bullish trade on a stock that recently broke higher off a level of support.
1M/6M Trends: Bullish/ Mildly Bullish
Relative Strength: 3/10
OptionsPlay Score: 120
Stop Loss: @ $0.88 Credit. (50% loss of premium paid)
Entering the Trade
Use the following details to enter the trade on your trading platform. Please note that whenever there is a multi-leg option strategy, it should be entered as a single trade.
Please note that these prices are based on Wednesday’s closing prices. Should the underlying move significantly during the pre-market hours, we will likely adjust the strikes and prices to reflect a more accurate trade entry.
$INTC

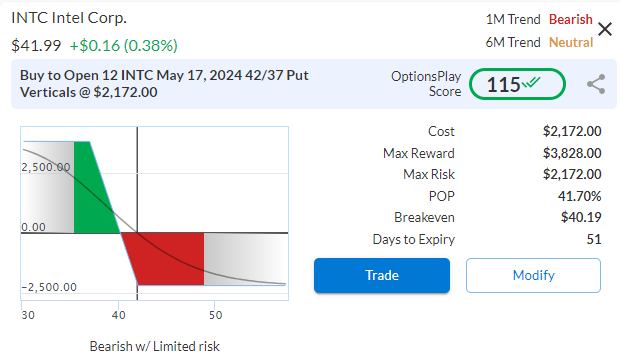
DailyPlay – Opening Trade (INTC) – March 27, 2024
INTC Bearish Opening Trade Signal
Investment Rationale
With semiconductor stocks losing momentum over the past few weeks, INTC’s strength is starting to show cracks and at risk of a pullback. After being in the lead of the semiconductor industry for nearly 2 decades, Intel’s design and fabrication model became their Achilles heel. Ever since INTC has been playing catchup, and early last year, investors started to pay attention, but perhaps the stock is starting to get ahead of itself on the back of an AI boom. This week’s news that China is phasing out INTC and AMD chips from their government usage will likely add further downside pressure.
Technical Analysis
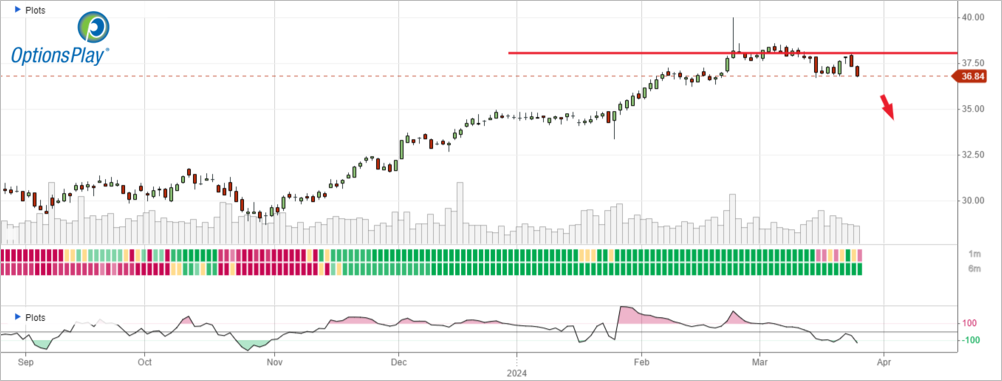
If look at a Chart of INTC over the past 18 months, the stock has doubled from below $24 to just over $50 at the end of last year. However, just after reaching those 52-week highs, INTC has underperformed the market considerably. The momentum turning negative, coupled with the poor relative strength, suggests INTC could be headed for some further downside toward its $37 breakout level.
INTC – Daily
Fundamental Analysis
Looking at the business, INTC is now trading at the richest valuation we have seen over the past decade at over 31x forward earnings. This is while analysts do not expect EPS and Revenues to recover to 2021 levels until 2027. There are a lot of unknowns with how the industry will transform with AI over the next 12-24 months, that I believe the current valuation is priced too high. Additionally, INTC’s historical valuation has ranged between 10-15x forward earnings over the past decade, and it’s now priced at double that. This leads to risks to the downside as relative strength and momentum slows for INTC.
Trade Details
Strategy Details
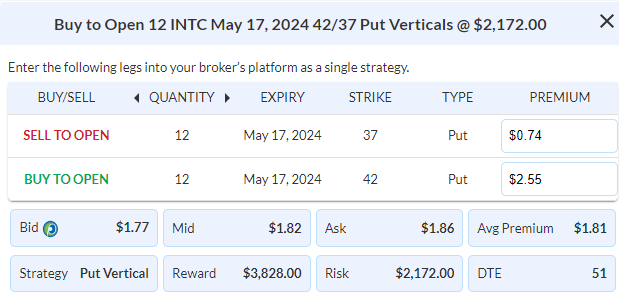
Strategy: Long Put Vertical Spread
Direction: Bearish Debit Spread
Details: Buy to Open 12 Contracts May 17th $42/$37 Put Vertical Spreads @ $1.82 Debit.
Total Risk: This trade has a max risk of $2,172 (12 Contracts x $182) based on a hypothetical $100,000 portfolio risking 2%. We suggest using 2% of your portfolio value and divide it by $182 to select the # contracts for your portfolio.
Trend Continuation Signal: This is a bearish trade on a stock that recently started to pull back from an area of resistance.
1M/6M Trends: Bearish/Neutral
Relative Strength: 8/10
OptionsPlay Score: 115
Stop Loss: @ $0.91 Credit. (50% loss of premium paid)
Entering the Trade
Use the following details to enter the trade on your trading platform. Please note that whenever there is a multi-leg option strategy, it should be entered as a single trade.
Please note that these prices are based on Tuesday’s closing prices. Should the underlying move significantly during the pre-market hours, we will likely adjust the strikes and prices to reflect a more accurate trade entry.
$CSX
DailyPlay – Opening Trade (CSX) – March 26, 2024
Closing Trade
- FDX – 122.26% Gain: Sell to Close 3 Contracts (or 100% of your Contracts) April 19th $260/$275 Call Vertical Spreads @ $13.18 Credit. DailyPlay Portfolio: By Closing all 3 Contracts, we will receive $3,954. We initially opened 3 Contracts on March 21 @ $5.93 Debit. The average gain, therefore, is $725 per contract with a total gain of $2,175 on our Portfolio; or just over 2% gain on our Portfolio.
CSX Bearish Opening Trade Signal
Investment Rationale
As the economy starts to show signs of slowing with elevated interest rates, railroad stocks are starting to show cracks. We’ve seen multiple railroad stocks slip last week, breaking below support and underperforming the market. This is a signal of potentially further weakness ahead and I’m taking a small bearish position to protect our long portfolio’s downside. In my opinion, any of the major rail stocks can be utilized for this thesis, but I will use CSX due to its better liquidity.
Technical Analysis
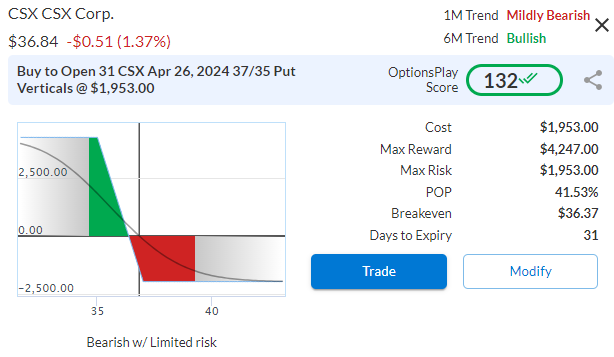
After rallying nearly 35% over the past 6 months, CSX has pulled back from its overbought conditions to test its $37.50 support level and starting to break lower. Combined with underperformance relative to the market and its sector, momentum turning negative, I see risks that CSX continues to pull back further.
CSX – Daily
Fundamental Analysis
CSX trades at over 19x forward earnings which is above its historical average. Given the macro environment of a slowing economy and rising fuel costs, there are risks to these higher valuations. Even if CSX were to trade at the top end of its historical valuation, puts the stock closer to $35, which would be my downside target.
Trade Details
Strategy Details
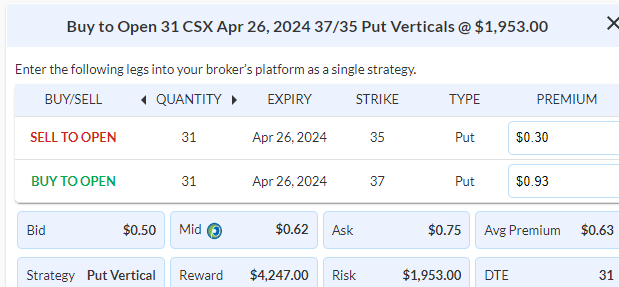
Strategy: Long Put Vertical Spread
Direction: Bearish Debit Spread
Details: Buy to Open 31 Contracts April 26th $37/$35 Put Vertical Spreads @ $0.63 Debit.
Total Risk: This trade has a max risk of $1,953(31 Contracts x $63) based on a hypothetical $100,000 portfolio risking 2%. We suggest using 2% of your portfolio value and divide it by $63 to select the # contracts for your portfolio.
Counter Trend Signal: This is a bearish trade on a stock that is pulling back from recent highs.
1M/6M Trends: Mildly Bearish/ Bullish
Relative Strength: 7/10
OptionsPlay Score: 132
Stop Loss: @ $0.32 Credit. (50% loss of premium paid)
Entering the Trade
Use the following details to enter the trade on your trading platform. Please note that whenever there is a multi-leg option strategy, it should be entered as a single trade.
Please note that these prices are based on Mondayy’s closing prices. Should the underlying move significantly during the pre-market hours, we will likely adjust the strikes and prices to reflect a more accurate trade entry.
$GOOGL
DailyPlay – Closing Trade (GOOGL) – March 25, 2024
Closing Trade
- GOOGL – 114.49% Gain: Sell to Close 6 Contracts (or 100% of your Contracts) April 5th $135/$150 Call Vertical Spreads @ $13.03 Credit. DailyPlay Portfolio: By Closing all 6 Contracts, we will receive $7,818. We initially opened 3 Contracts on March 1 @ $5.48 Debit., and then another 3 Contracts on March 14@ $6.67 Debit. The average gain, therefore, is $697 per contract with a total gain of $4,176 on our Portfolio.
Investment Rationale
With GOOGL reaching the upper strike price of our vertical spread and less than 2 weeks to expiration, we are trading less than $2 away from the maximum gain on the $15 wide debit spread. This is a good time to take profits on our trade, locking our biggest win for 2024 so far. This was a gain of 4.1% of the portfolio’s value or about 4 times our average losing trade.
$BMY
DailyPlay – Closing Trade (BMY) – March 22, 2024
Closing Trade
- BMY – 51.48% Loss: Sell to Close 10 Contracts (or 100% of your Contracts) May 17th $52.50/$57.50 Call Vertical Spreads @ $1.15 Credit. DailyPlay Portfolio: By Closing all 10 Contracts, we will receive $1,150. We initially opened these 10 Contracts on March 11 @ $2.05 Debit. Our average loss, therefore, is $90 per contract, translating to less than 1% of our total Portfolio.
Investment Rationale
Despite a breakout above $53 on strong volume, BMY has pulled back into its trading range and we have to accept that the timing on the trade just didn’t work out, we’re going to close out this trade and focus on managing our winners with GOOGL and FDX.
$FDX
DailyPlay – Opening Trade (FDX) – March 21, 2024
FDX Bullish Opening Trade Signal
Investment Rationale
FDX reports earnings after the close today and presents an opportunity to add long exposure going into the event. With recent shipping outlooks improving across the board, FDX’s recent underperformance provides a rare opportunity to add FDX to your portfolio before the event. Options provide us the ability to capture potential upside with limited risk.
Technical Analysis
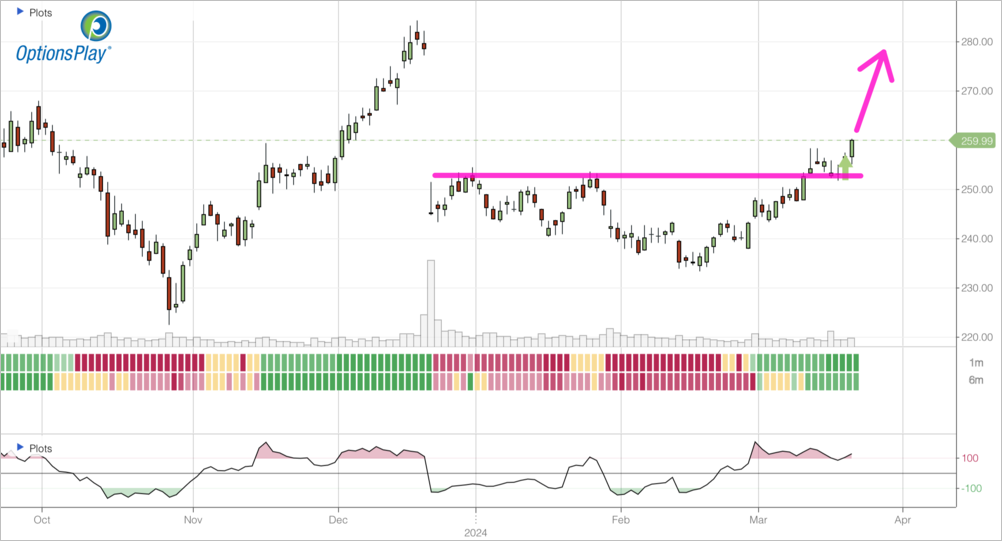
FDX has traded between $235 and $250 after breaking down on last quarter’s disappointing earnings. But over the past few days there are signs that the consolidation range is starting to breakout higher with decent volume. Couple this with relative outperformance to the overall market, sets up for a potential breakout confirmation with earnings as a catalyst after the close today.
FDX – Daily
Fundamental Analysis
DX trades at only 11x forward earnings while analysts expect about 11% EPS growth for next year. That is a fair bit higher than the rest of the market despite trading at a 50% discount to the S&P 500. If we hear a positive outlook for 2024 on earnings tomorrow, that could unlock significant value for investors.
Trade Details
Strategy Details
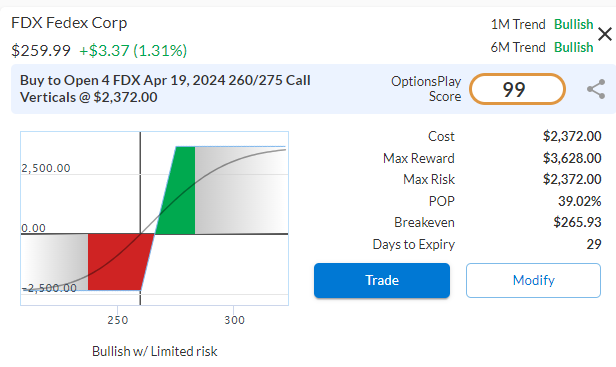
Strategy: Long Call Vertical Spread
Direction: Bullish Debit Spread
Details: Buy to Open 3 Contracts April 19th $260/$275 Call Vertical Spreads @ $5.93 Debit.
Total Risk: This trade has a max risk of $1,779(3 Contracts x $593) based on a hypothetical $100,000 portfolio risking 2%. We suggest using 2% of your portfolio value and divide it by $593 to select the # contracts for your portfolio.
Trend Continuation Signal: This is a bullish trade on a stock that recently broke higher from an area of support.
1M/6M Trends: Bullish/Bullish
Relative Strength: 6/10
OptionsPlay Score: 99
Stop Loss: @ $2.97 Credit. (50% loss of premium paid)
Entering the Trade
Use the following details to enter the trade on your trading platform. Please note that whenever there is a multi-leg option strategy, it should be entered as a single trade.
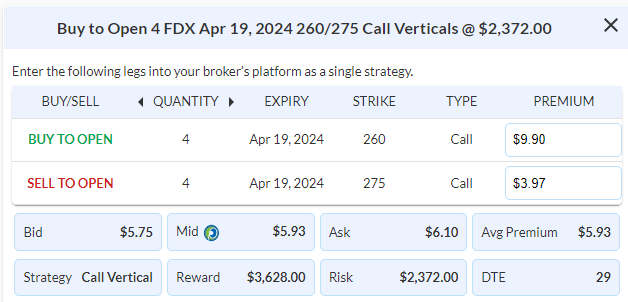
Please note that these prices are based on Wednesday’s closing prices. Should the underlying move significantly during the pre-market hours, we will likely adjust the strikes and prices to reflect a more accurate trade entry.
$TLT
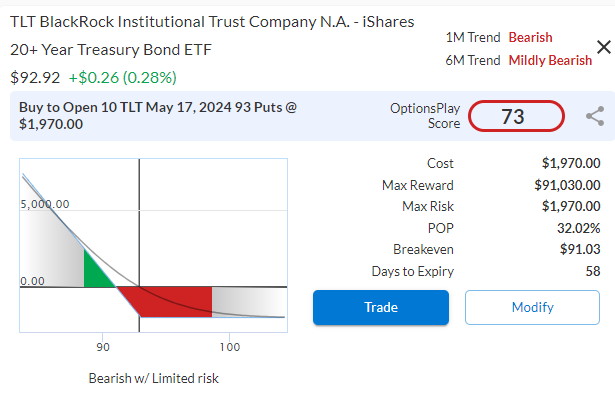
DailyPlay – Opening Trade (TLT) – March 20, 2024
TLT Bearish Opening Trade Signal
Investment Rationale
While the market expects no changes to interest rates during the FOMC meeting today, investors are paying attention to the updated dot plot. With last week’s hotter-than-inflation print, rising commodity prices, shipping disruptions, and a strong labor market, will the median dot plot reflect any changes? In my opinion, there is the risk that the median dot plot can shift to expecting only 2 rate cuts this year instead of the 3 the bond markets are pricing in. While this may not have a significant impact on equities, bonds will likely sell off further on such news. I propose putting on a hedge using TLT against rising rates going into today’s meeting.
Technical Analysis
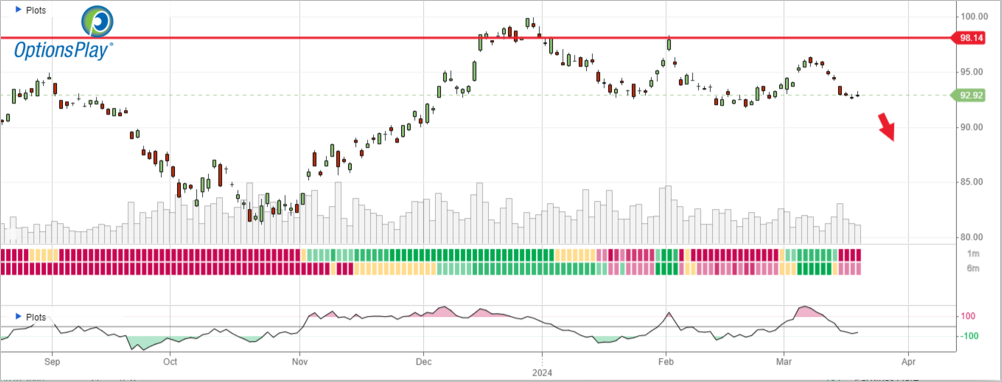
TLT has traded largely within a range of $92 and $98 and it’s been testing the $92 support level over the past few days. A catalyst such as a change in the median dot plot, or rhetoric from Chair Powell could send bonds lower. Putting on a hedge here would protect against a breakdown below these levels.
TLT – Daily
Trade Details
Strategy Details
Strategy: Long Put
Direction: Bearish Put
Details: Buy to Open 10 Contracts May 17th $93 Puts @ $1.97 Debit.
Total Risk: This trade has a max risk of $1,970 (10 Contracts x $197) based on a hypothetical $100,000 portfolio risking 2%. We suggest using 2% of your portfolio value and divide it by $197 to select the # contracts for your portfolio.
Trend Continuation Signal: This is a bearish trade on a stock that is in a bearish trend.
1M/6M Trends: Bearish/ Mildly Bearish
Relative Strength: 4/10
OptionsPlay Score: 73
Stop Loss: @ $0.99 Credit. (50% loss of premium paid)
Entering the Trade
Use the following details to enter the trade on your trading platform. Please note that whenever there is a multi-leg option strategy, it should be entered as a single trade.
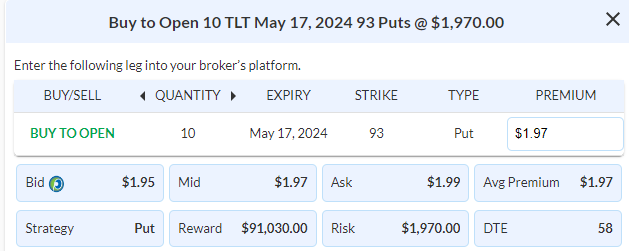
Please note that these prices are based on Tuesday’s closing prices. Should the underlying move significantly during the pre-market hours, we will likely adjust the strikes and prices to reflect a more accurate trade entry.
$AAPL
DailyPlay – Closing Trade (AAPL) – March 19, 2024
Closing Trade
- AAPL – 31.15% Gain: Sell to Close 10 Contracts (or 100% of your Contracts) April 5th $170/$180 Call Vertical Spreads @ $4.69 Credit. DailyPlay Portfolio: By Closing all 10 Contracts, we will receive $4,690. We initially opened 6 Contracts on March 6 @ $3.28 Debit, and then 4 Contracts on March 13 @ $4.01 Debit. The average gain, therefore, is $112 per contract with a total gain of $1,120 on our Portfolio.
Investment Rationale
After a strong open on the back of AI rumors, price action was extremely weak all session and closed at the lows. This type of price action is not favorable to our long position with positive time decay. As we approach the last 2 week before expiration I believe now is time to close out our AAPL position today.